Your location & your needs
We start with a conversation, not a catalogue. What do you need to measure or observe? Heat stress, air pollution, soil moisture â or a combination? We map your operational questions to the exact parameters that answer them, and identify the optimal sensor placement for your site.
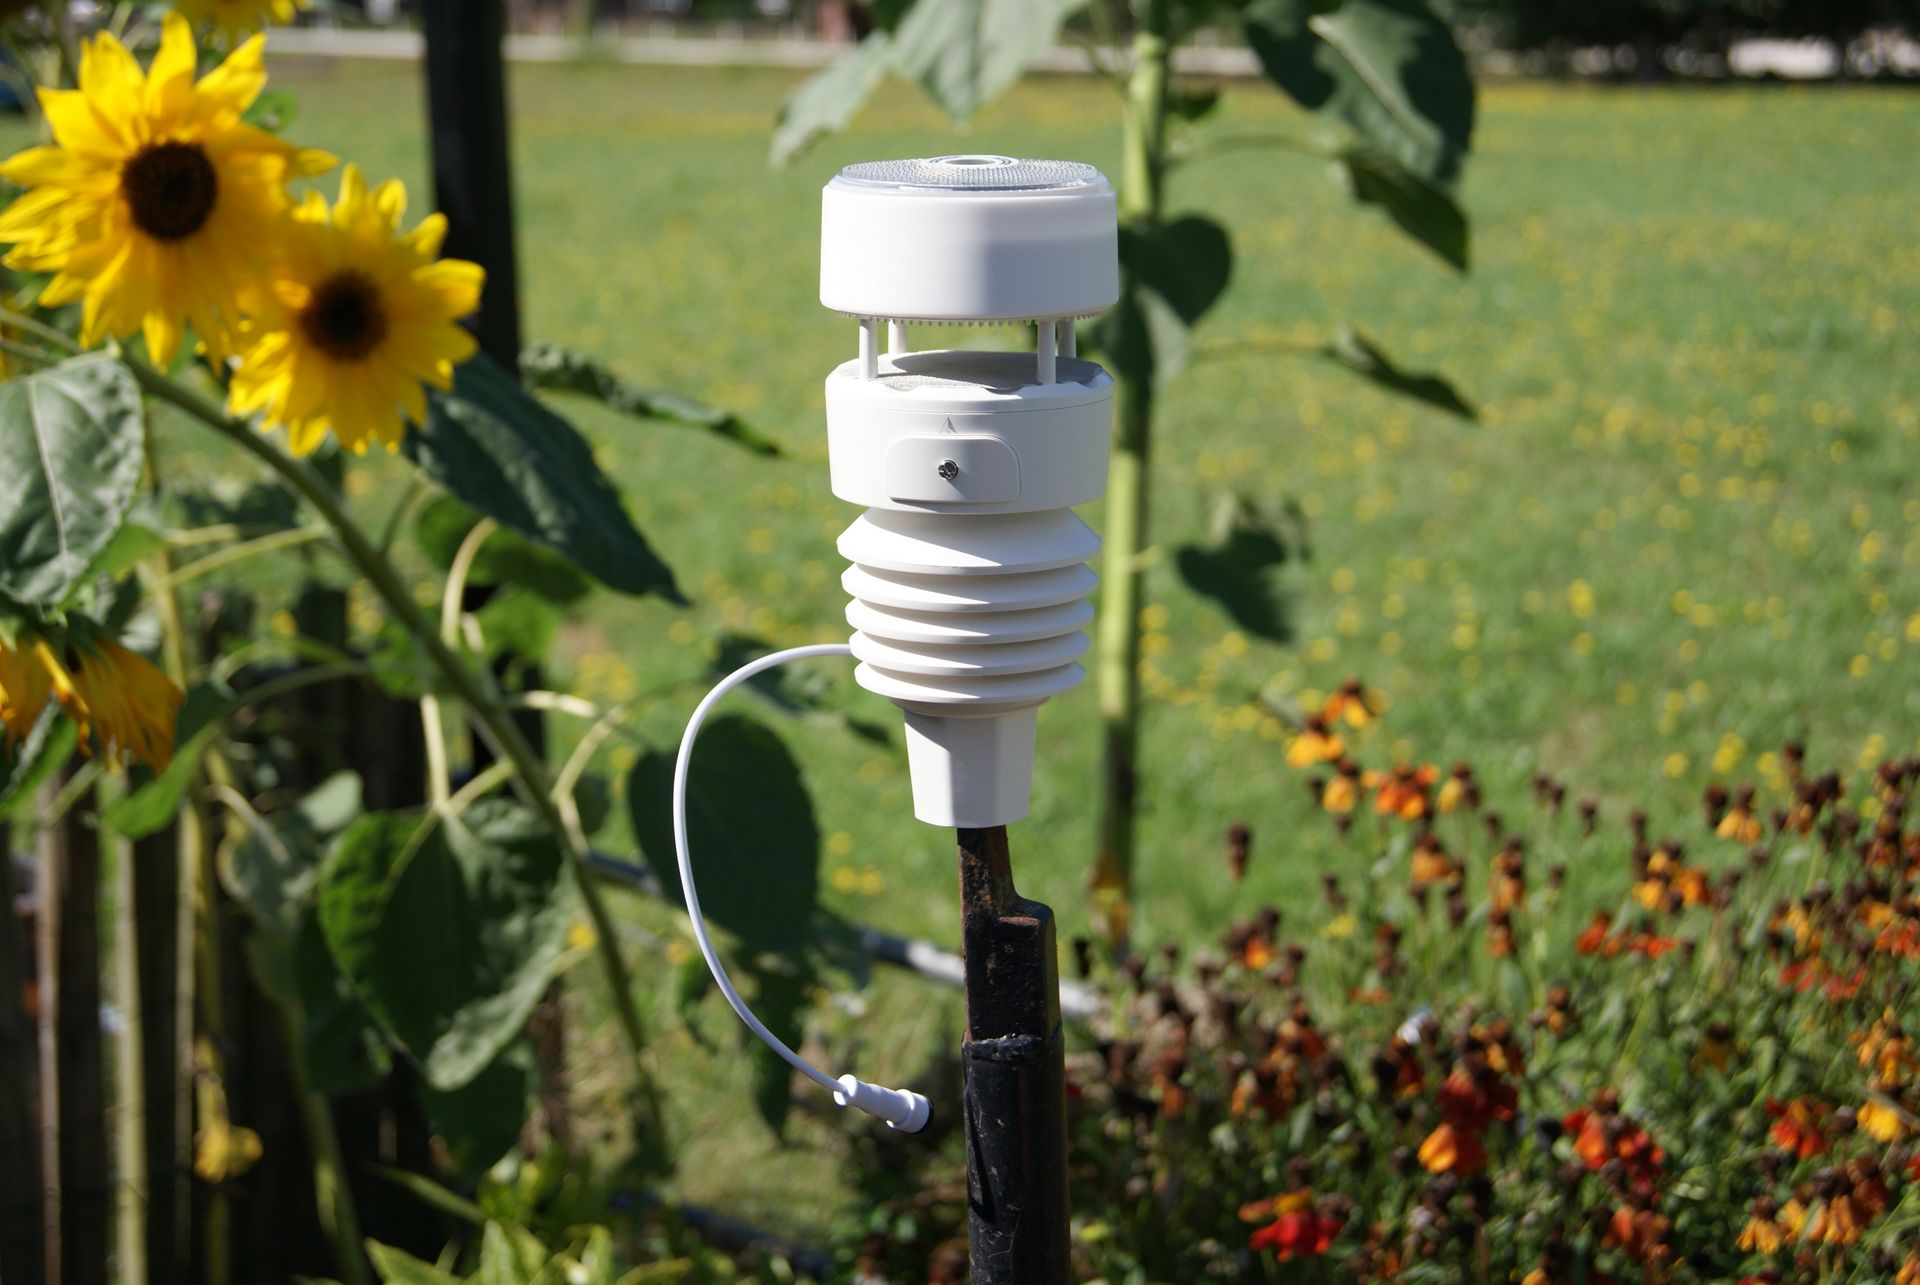
Bespoke instruments, built for your site
No power? No internet? No problem. Our instruments are entirely self-sufficient â solar-powered, battery-backed, and transmitting over 4G mobile networks or LoRaWAN. We select and configure professional-grade sensors for your environment: exposed coastal sites, remote agricultural land, or dense urban settings.
Your dashboard, your conditions
A reliable, informative dashboard designed to your requirements and available where you need it. Want public data? We host fully public-facing dashboards. Private or sensitive information? Our dashboards are tailored to your strict security conditions â role-based access, private hosting, or fully air-gapped if needed.
Enhancements through intelligence
Your on-site data is the foundation. We layer in satellite imagery, numerical weather models, historical climate baselines and domain-specific analytics to give your measurements true context â crop stress indices, storm tracking, long-range forecasts tuned to your exact location. We make full use of what your bespoke station captures.